on
Building a Lox Interpreter in Safe Rust
Code for this project can be found here
I recently decided to pick up the famous (among SWEs at least) Crafting Interpreters book, and try my hand at writing its Part III bytecode interpreter in safe Rust. This code is written in C, so it would be an interesting exercise in figuring out the differences between the two languages and any relative strengths or limitaitons.
This is by no means an original work, and throughout the development process I had the pleasure of learning from several other Rust implementations that exist in the wild. In particular, I would like to credit
- Loxido and the insightful accompanying blog
- Loxcraft, which takes performance to the next level
- Lox-lang which I discovered later on and follows the same ideas for garbage collection
Background
The objective of the book is to write an interpreter from the Lox language (grammar here) from scratch, which brings together multiple components; scanning and parsing of some source code:
var message = "Hello, World!";
print message;
Compilation of that parsing output into some intermediate representation (in the form of bytecode):
Opcode    Line
0000         1  Constant       [constant: Hello, World!]
0002         |  DefineGlobal   [constant: message]
0004         2  GetGlobal      [constant: message]
0006         |  Print
0007         |  Nil
0008         |  Return
and finally interpretation of that bytecode into the final output: Hello, World!
This blog does not set out to re-teach the book’s content, but I think one area in particular is worth diving into a bit more depth - garbage collection. Lox is a high level language, and its memory is handled behind-the-scenes by the implementing language.
Garbage Collection
Immediately, this was one clear difference between C and Rust. The original implementation uses the mark and sweep alogorithm, which is a form of tracing garbage collection that involves maintaining shared pointers to objects allocated on the heap, and scanning through them from some root location to find which objects are reachable - and therefore conversely which objects are unreachable and up for de-allocation.
This seemed like a perfect opportunity to deviate from the book, and flex some Rust muscles. Under the hood, Rust doesn’t use a “traditional” garbage collector, but instead implements resource management through RAII (Resource Acquisition Is Initialization) and reference counting. So instead of manually implementing a garbage collector, I could let Rust do it for me, right?
Issues in Rust
First we must address shared borrows of the heap-allocated objects. At runtime there will be at least two places we want to hold references to our objects, and likey more:
- On the stack; Lox is a stack-based language, and we will be juggling references to values on and off the stack as the progamme runs.
- In our compiled code chunks; we allocate at runtime and hold references until they are no longer needed:
pub struct CodeBlock {
    pub constants: [Value; CONSTANTS_MAX_COUNT],
    ...
}
This Value item is an enum, whose variants hold data on the stack - either primitive types, or references to the heap. Since we need shared borrowing (and in a single-threaded environment) these references take the form of reference counted type Rc<T>. Reference counts increase as more owners share the data, and as owners drop out of scope eventually the reference count ticks down to zero and the memory will be cleaned up for us.
We also need to mutate some objects (for example class instance values with mutable members). So we need to turn to interior mutability here via the RefCell<T> type - this allows us to expose a safe interface for mutating data even behind an immutable reference.
Introducing interior mutability unfortunately exposes us to a common problem in the form of leaked memory via circular references. We are still in the land of “safe” rust, without dangling pointers and undefined behaviour. However the programme is now unsound. Consider the following, which will leak memory:
Class Person {}

{
  var alice = Person();
  var bob = Person();
  alice.friend = bob;
  bob.friend = alice;
}
// alice and bob dropped, but still hold a reference to each other
This problem of circular references is often attempted to be solved via introduction of weak references - these look like std::rc::Weak<T> and can be created via the Rc::downgrade(&self) method. If only weak references are left to an object, then it will be de-allocated and any attempt to access it will yield an empty Option::None. However this is often only viable if you can mould your domain to fit weak references; for example if you have a tree structure with weak references from child nodes to parent nodes (where parents will always outlive children). Alas, the Lox grammar allows for cyclic references, so we are stuck.
Aside: one highlight of memory leaking I came across while building this project is the ability to leak memory via reference count overflow. Ouch.
Can It Be Done safe™?
I spent a regretable amount of time reading up on the issue of garbage collection in Rust, and trying to make something work with pure Rust - I should have stopped earlier. Great amounts of research and review have gone into this topic, and an excellent review of the space can be found here. In particular, I was drawn to one particular implementation by Catherine West, who clearly faced the same issue when creating piccolo, an interpreter for the Lua language (great blog post on the topic here).
I decided to run with this and use the underlying gc-arena crate as a chance to learn from advanced Rust in the process. Internally I struggled with the notion that I wasn’t still leveraging “safe” Rust - the crate itself claims and looks to be safe, but under the hood uses unsafe. This is a blurred line you have to use your own judgement for; after all, the standard library is built on tons of unsafe Rust, even the Rc<T> type I so wanted to leverage intitially. It’s all a trust game.
One interesting trick the gc-arena crate pulls to underpin its safety is leveraging lifetime subtyping and variance. The Rustonomicon covers the topic in more depth, but I’ll attempt to summarise here:
Covariance means that if A is a subtype of B, then F<A> is a subtype of F<B>. For example in Rust, immutable references are covariant over their lifetimes. What this means is if we have two immutable references &'longer T and &'shorter T, then since a longer lifetime outlives a shorter lifetime (so is a subtype), then the longer lifetime reference is a subtype of the shorter reference lifetime. This subtyping enables the compiler to implicitly shorten lifetimes to ease borrowing rules for covariant types. Types such as &'a mut T are invariant over their lifetimes and so require exact matching of type parameters, preventing both subtyping and supertyping relationships.
fn bar<'a>() {
    let s: &'static str = "hi";
    let t: &'a str = s;  // this assignment is allowed since `s` is a subtype of `t`
}
So to extend this idea, if we have some arena (of garbage collected values), we want to be sure that there are no live references to those values when garbage collection happens. By modelling pointer objects given out by the arena to be invariant over their lifetime, then we can isolate usage of these pointers and be confident that outside of these isolated areas, the pointers are safe to be collected! This is achieved using PhantomData, where can create invariance over the pointer’s lifetime with zero additional overhead, since PhantomData is a zero sized type.
// Struct has the size of a machine pointer and can implement Copy - great!
pub struct Gc<'gc, T>
    where T: ?Sized + 'gc {
    // This type is a pointer.
    ptr: NonNull<GcBox<T>>,

    // We also contain a `PhantomData` type which marks the struct as being
    // *invariant* over the 'gc lifetime since Cell<T> is invariant over T
    _invariant: PhantomData<Cell<&'gc ()>>,
}
The core loop of our Lox interpreter jumps between two states: interpreting steps that mutate the arena state in isolated closures (which have their own invariant lifetime for handling pointers to heap values), and garbage collecting the arena.
Performance Optimisation
In optimising performance of my Lox implementation, I wanted to see how close I could get to the C clox implementation without dipping into unsafe Rust. Inheriting garbage collection through gc-arena already gives me a sort of “cheat” head-start here, through the use of pointer types that implement Copy and avoid the reference counting overhead of Rc<T>. This final section outlines some of the techniques I learned about and used to improve runtime performance. I don’t go down a crazy rabbit hole, but thought it would be fun to pick up some tricks and document them here!
Overarching all of this is the use of a profiler to hone in on methods that were eating up CPU time. For this I am using MacOS and the samply tool to output performance profiles and visualise using FireFox Profiler. I also used the native profiler “Apple Instruments” via cargo-instruments, which additionally has tools to check for allocation metrics and monitor memory usage.
Using flamegraphs and flame charts here helped the most to notice areas of the code where performance gains could be found, and also encouraged me to further modularise the code to better understand which nested function calls were being hit heaviest. Brendan Gregg has great talks and resources on the topic for deeper understanding of how to analyse these charts.
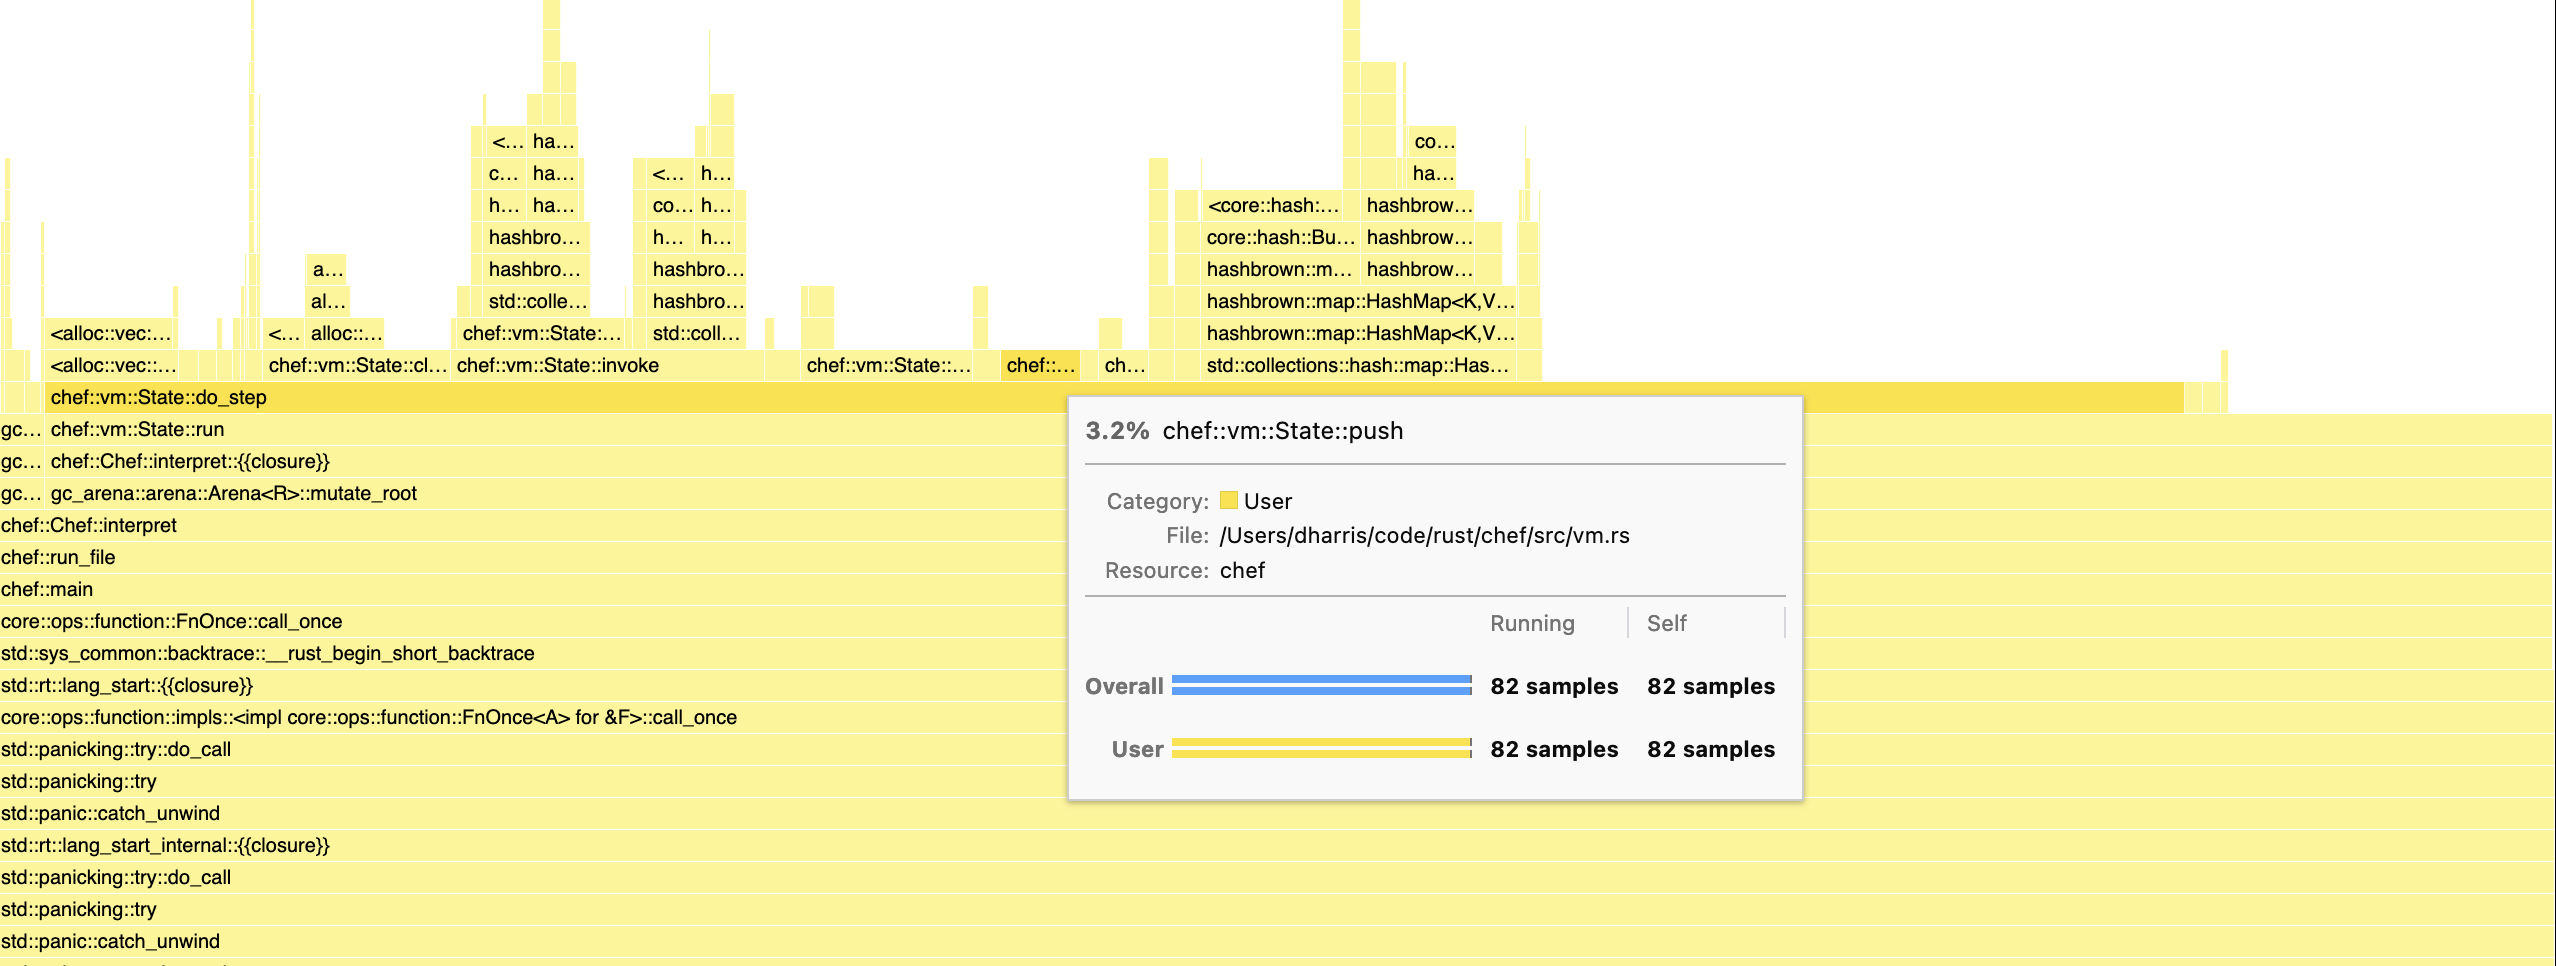 This chart for example shows that pushing values onto our Lox stack takes up ~3% of overall time in our interpreter steps. This could be a candidate for optimising e.g. through removing bounds checks using assertions
Profiling Tips in Rust
When profiling code, we are most interested in running --release builds of our code, which makes it faster at runtime through taking advantage of methods like clever compiling optimisations and spending time allocating variables to CPU registers. This is additionally at the cost of removing debug symbols, which are useful for debugging tools but bloat the executable.
However when profiling code, we need these debug symbols around to understand which functions have been sampled. How should we build in release mode with debug symbols, especially when we don’t want our final release build to contain them? Sounds fiddly to constantly amend the Cargo.toml file. Thankfully, here we can leverage cargo profiles and inheritance:
[profile.release]
codegen-units = 1
lto = "fat"
panic = "abort"

[profile.profiling]
inherits = "release"
debug = true
strip = false
By running profiling using a dedicated cargo profile, we can inherit all the release properties of our regular release profile, while adding attributes required to do proper profile testing (strip = false here instructs the compiler to avoid removing debug symbols from the binary too). No more mental overhead remembering the state of your release profile.
In addition to profiles, I also wanted to mention “inlining”. The compiler will ultimately do what it wants - if a function is called many times (it’s hot) and is small / doesn’t have its own nested function calls, it is a good candidate for inlining, which will replace the function callsite with the function code itself. This reduces code jumping at runtime, at the cost of larger executable size. However when profiling an application, sometimes a function is inlined which disables you from analysing the line-by-line performance of the function at runtime. Here, subtle hinting to the compiler by using #inline(never) can be helpful.
Techniques
Hashing
This is mentioned by many other write-ups on Lox implementation, and switching the default HashMap hasher indeed did help with performance. However, more interestingly, larger speedups were found in my personal implementation through patching the underlying Gc<'gc, T> pointer type provided by gc-arena (used as map keys).
Hashing and equality were implemented by dereferencing to the underlying type and using that. But if we look at how primitive pointers implement Hash and PartialEq, it uses the pointer address itself. This simple change resulted in speedups of 30 to 50 percent across benchmarks.
impl<'gc, T: Hash + ?Sized + 'gc> Hash for Gc<'gc, T> {
    fn hash<H: Hasher>(&self, state: &mut H) {
        ptr::hash(Gc::as_ptr(*self), state);
    }
}
Option Unwrapping
This one is less exciting, but caught me off guard. When fetching a variable from our local code block, a simple map from string to value is used. Lookup has potential to return an empty Option::None, and so .ok_or(Error::UndefinedVariable(string))? was used to safely unwrap the value or propagate a runtime error.
However, this method showed up a lot when profiling -it turns out that the construction of this error variant was not lazy, and so string cloning and allocation was happening even on the happy path. The way around this was to instead use .ok_or_else(|| Error::UndefinedVariable(string))? to defer the unhappy path allocations.
Enum Sizing
One idea I had was to re-model the opcode enum that I used to represent operations in the virtual machine - initially I used data-carrying variants to model operations that required extra bytes of information to work. For example:
enum Operation {
  Return,
  Add,
  Jump(u8),  // u8 represents frame pointer jump distance
  ...
}
This simple model worked well and is clean - when reading the Jump opcode, we immediately have access to jump offset data. However this enum would have a size in memory determined by the size of its largest variant (see details on memory and alignment here). In general it is best to use smaller types where possible, to maximise the amount of data the CPU pulls into its cache lines in one go, speeding up the programme runtime. So I switched up the enum:
enum Operation {
  Return,
  Add,
  Jump,
  ...
}
Now, when a Jump byte was read, an extra byte would need to be read to also fetch the jump offset data. In practice, this did not result in the sort of speed-ups I expected. Code needed to be stored as a Vec<u8> rather than Vec<Operation> to be able to also store additional opcode data, and conversions from u8 to Operation were now showing up as hot in the profiler.
Going against my preference for type safety and leveraging enum-exhaustiveness, I decided to model operations instead as const u8 values and match on those. This appeared to have a more noticeable impact on performance.
Results
Plotted below is a comparison of each model (baseline, baseline + optimisations, original book implementation clox) run on each benchmark test, using a weighted average across five runs:
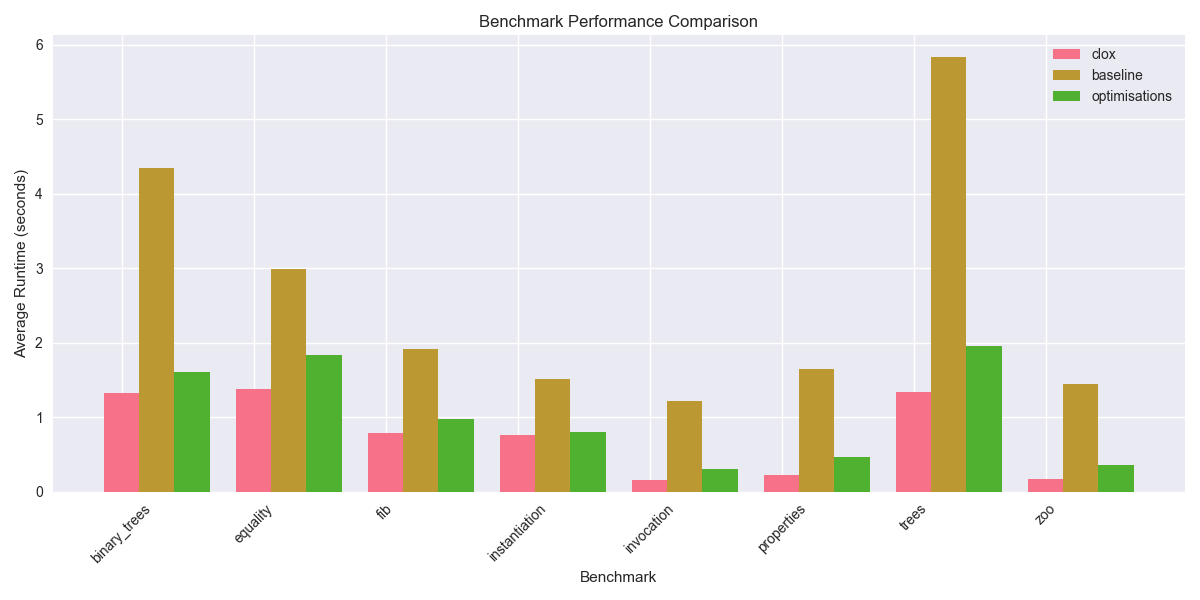
I think overall this looks positive - using some simple profiling analysis, the performance of the safe Rust interpreter was cut down to within touching distance of clox. There is always more that can be investigated - further hotspots in the profiling, garbage collection parameter tuning, profile-guided optimisation, using SIMD instructions, fine tuning hash and allocator combinations, … I’m happy enough with what I’ve learned to stop here!
My main takeaway from this exercise has been that safe Rust is powerful, but needs careful attention to really squeeze performance out of it (and likely also descension into unsafe Rust). Without a clox benchmark to compare against, how would I know that “my Rust is as fast as C”? My general feeling is that, in the hand-crafted cases, it often might not be. However, when the positive trade-off is better memory safety and protections that greatly improve developer velocity, I will take that trade nine times out of ten.